BALTIMORE (Stockpickr) -- Congress pulled the knife off of its own throat on Wednesday with a predictable budget deal that kicks the can down the road for a few more months. Then we get to do it all over again!
But for now, the gaping risks of a government default on the national debt are gone -- and markets are reacting with relief. That's actually pretty good timing as earnings season kicks into high gear and stocks move into what's historically the best time of the year.
Regardless of what's going on in the big picture, though, some of the biggest individual names on Wall Street are showing investors some tradable setups. Today, we're taking a closer technical look at five of them.
If you're new to technical analysis, here's the executive summary.
Technicals are a study of the market itself. Since the market is ultimately the only mechanism that determines a stock's price, technical analysis is a valuable tool even in the roughest of trading conditions. Technical charts are used every day by proprietary trading floors, Wall Street's biggest financial firms, and individual investors to get an edge on the market. And research shows that skilled technical traders can bank gains as much as 90% of the time.
Every week, I take an in-depth look at big names that are telling important technical stories. Here's this week's look at five high-volume stocks to trade this week.
BlackRock
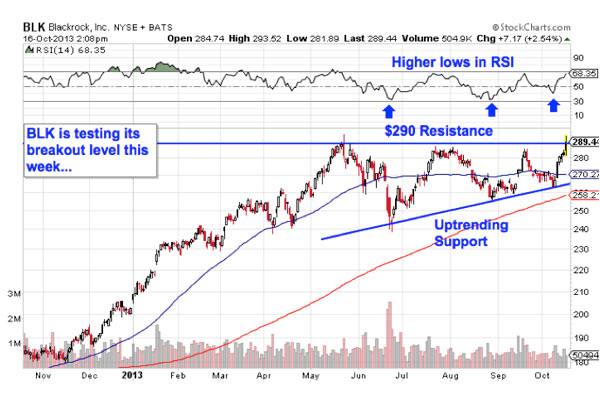
First up is asset management giant BlackRock (BLK). It shouldn't be surprising that BlackRock has posted impressive performance so far in 2013; as the world's largest asset manager, BLK is basically a leveraged bet on stock prices. But despite a 40% rally since the calendar flipped over to January, the setup in shares points to more upside into the fourth quarter.
That's because BlackRock is currently forming an ascending triangle pattern, a bullish formation that's set up by a horizontal resistance level above shares -- in this case at $290 -- and rising support to the downside. Basically, as BLK bounces between those two technical price levels, it's getting squeezed closer and closer to a breakout above that $290 price ceiling. When that happens, it's time to be a buyer.
It makes sense to sell (or short) shares on a move through that key support level.
Whenever you're looking at any technical price pattern, it's critical to think in terms of buyers and sellers. Triangles, and other pattern names are a good quick way to explain what's going on in a stock, but they're not the reason it's tradable. Instead, it all comes down to supply and demand for shares.
That support level at $111 is a price where there had been an excess of demand of shares; in other words, it's a place where buyers have been more eager to step in and buy shares at a lower price than sellers are to sell. That's what makes a breakdown below $111 so significant -- the move would indicate that sellers are finally strong enough to absorb all of the excess demand above that price level. That's why it makes sense to wait for that trigger before you sell.
Top Cheapest Stocks To Watch For 2016
Netflix
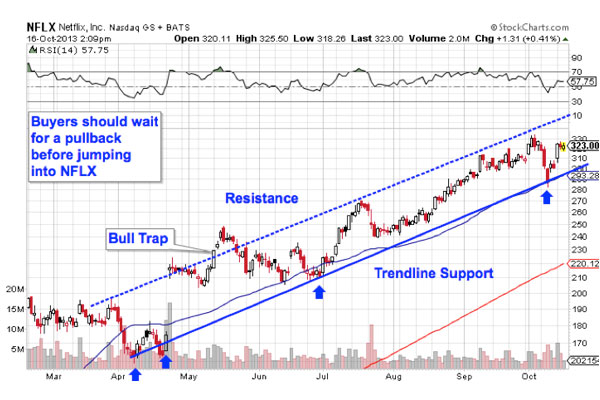
It's been quite a year for shareholders in Netflix (NFLX). Since the first trading session of the year, shares of the streaming video service have rallied 258% -- enough to squeeze out some of the loudest short sellers in this stock. But you don't have to be an expert technical analyst to figure out why Netflix continues climbing; this stock is still in a textbook uptrending channel right now.
Channels are valuable for traders because they provide high probability ranges for a stock's price action. In other words, Netflix's price is unlikely to trade outside of those two bands on the chart above -- and that's exactly what makes this stock tradable right now.
Buying off a support bounce makes sense for two big reasons: it's the spot where shares have the furthest to move up before they hit resistance, and it's the spot where the risk is the least (because shares have the least room to move lower before you know you're wrong). And by actually waiting for the bounce to happen first, you're ensuring the Netflix can actually still catch a bid along that line.
With shares around the center of the channel right now, it makes sense to do some waiting if you're looking for the ideal time to buy shares. But the channel is narrow enough that buyers won't be waiting long. When the time comes, I'd recommend keeping a protective stop at the 50-day moving average.
American Express
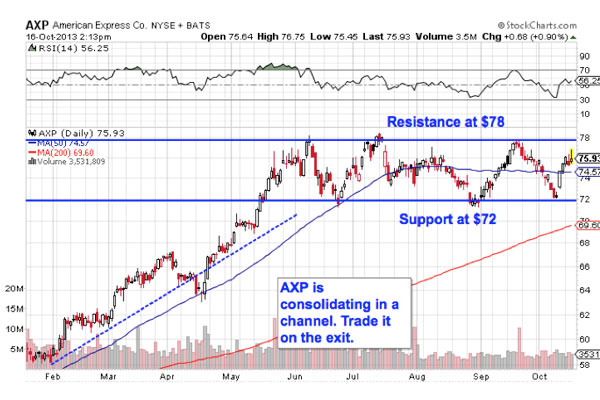
Even though American Express (AXP) has gotten buoyed alongside the rest of the financial sector in 2013, most of the excitement came in the first couple of quarters this year. Since then, shares have been slugging their way sideways ever since the start of the summer. But this stock is still tradable. Here's how:
Like Netflix, American Express is currently in a channel of its own, bounded by horizontal resistance at $78 and horizontal support below shares down at $72. The key difference between the two charts is the fact that AXP's channel is completely horizontal, unlike the uptrend in NFLX. While that tells us that the bias is less heavily skewed towards buyers, there's still a trade in this stock thanks to the rectangle in shares.
The rectangle gets its name because it effectively "boxes in" a stock's price action between two horizontal levels -- when a stock breaks out from the range, it becomes tradable. So the buy signal for AXP comes on a breakout above the $78 level, whereas a sell comes if shares fail to catch a bid and fall through $72. Until AXP exits the consolidation, stay away.
Disney
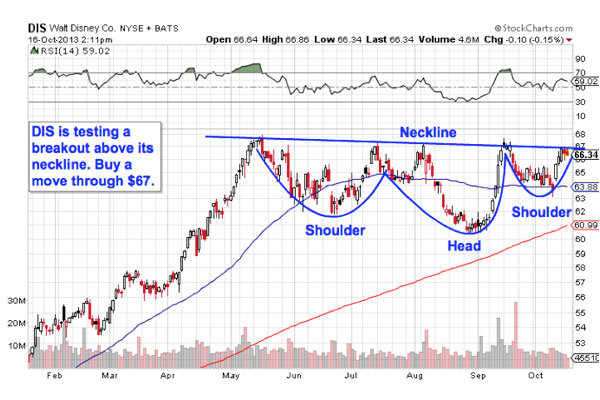
Last up is Disney (DIS), a stock that's showing some signs of life after meandering sideways since the start of the summer. Now $67 is the level to watch for a breakout in this entertainment giant.
Disney is currently forming an inverse head and shoulders pattern, a bullish setup that indicates exhaustion among sellers. The pattern is formed by two swing lows that bottom out around the same level (the shoulders) that are separated by a deeper low in between them (the head). The buy signal comes on a move through the neckline, which sits right at $67 for shares of DIS right now. That means that this Mickey Mouse and friends could be looking at a breakout in today's session.
If you think that the head and shoulders is too well known to be worth trading, the research suggests otherwise: a recent academic study conducted by the Federal Reserve Board of New York found that the results of 10,000 computer-simulated head-and-shoulders trades resulted in "profits [that] would have been both statistically and economically significant." That's good reason to keep an eye on both of these names in the next few sessions.
To see this week's trades in action, check out this week's Must-See Charts portfolio on Stockpickr.
-- Written by Jonas Elmerraji in Baltimore.
No comments:
Post a Comment